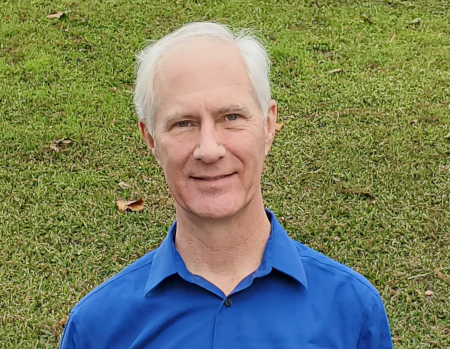
This is the home page for Steven Reynolds. I am a Software and Project manager living in Houston, TX. I currently work at INT, a software company specializing in graphics libraries and enterprise viewers for the energy industry.
My github account is stevenreyn. My main project there is RegionViewer. This project exports a graph of objects on the Java Virtual Machine to a graph file. This project allows you to visualize the object graph as operations are applied. The graph is very enlightening for purely functional data structures. I have used this code for some of my talks/papers.
I am a member of the Clojure Houston User Group . In the past, we met on the fourth Thursday of each month.
Here are a few talks that I have given — some are recent and some are less so.
| INT: Seismic Data Visualization Platform Designed for Cloud | This is a presentation on IVAAP that I did with AWS for “This is My Architecture Series” in 2020. | ||
|---|---|---|---|
| Intro To Julia: A Great Language for Data Analytics | Julia is a super interesting technical computing language. A talk that I gave at Houston TechFest 2015. | ||
| Immutable Collections from Scala and Clojure | Immutability provide some special benifits as well as some performance challenges that I find interesting. A talk that I gave at JavaOne 2013. | ||
| Clojure Collections | Clojure is a new Lisp for the JVM with very special support for concurrency. The talk focuses on how purely functional collections work. From Houston Techfest 2011. | ||
| A Brief Introduction to Scala | Scala is a new language for the JVM combining functional and object oriented styles. From JavaOne 2010 and Houston Techfest 2009. | ||
| Java Scenegraph | The scene graph library is used by JavaFX to draw graphics. From Houston TechFest January, 2009. | ||
| Performance Statistics of Java Applications Using DTrace and Chime | Presentation about DTrace: a tool that allows you to gather data from thousands of probe points in the system. And Chime: a tool to graph DTrace data. From JavaOne 2007. |
